Contents
| 1. | What is lida? |
| 2. | Short overview of planned features |
| 3. | Why lida? |
| 3.1 | Limitations of objdump based disassemblers |
| 4. | Implementation Details |
| 4.1 | Some words about the disassembling engine |
| 4.2 | Some words about the crypto analyzer |
| 5. | What is the current status? |
| 6. | Screenshots |
| 7. | Where can I download? |
| 8. | Credits |
1. What is lida?
lida is basically a disassembler and code analysis tool. It uses the bastards libdisasm for single opcode decoding (see http://bastard.sourceforge.net/libdisasm.html).
It allows interactive control over the generated deadlisting via commands and builtin tools.
2. Short Overview of (planned) features
- ELF, RAW file disassembly (generating stringtable, symboltable, crossreferences, ... )
- trace execution flow of binary
- work with symbolic names: interactive naming of functions, labels, commenting of code
- scan for known anti-debugging, anti-disassembling techniques
- scan for user defined code sequences
- integrated patcher
- integrated cryptoanalyzer
- handy ("intelligent") browsing
- openssl support (customizeable "init values", apply to programs datablocks)
3. Why lida?
The project lida was initiated because of the lack of handy reverse engineering software for linux. Therefore it is designed to (and should) fit several needs of some typical reverse-engineering sessions.
lida addresses people who like to work on deadlistings, and should be especially useful for people with previous experience in windows reverse engineering. lida should be a good "entry point" for examining the "new targets".
A typical use is to run it while debugging your program and comment the deadlisting / name functions with the information gathered.
So basically it is a disassembler. Why another one? :)
Many disassemblers out there use the output of objdump - lida tries a more serious approach. The several limitations of objdump (see 3.1) are broken by using libdisasm (thx to HCUNIX!), and by tracing the execution flow of the program.
Further, by having the control over the disassembly - more features can be included. Everybody who has already worked on some deadlisting will immediate feel a need to work interactive with the code - and be able to change it.
Therefore lida will have an integrated patcher, resolves symbolic names, provides the ability to comment the code, serves efficient browsing methods, ...
The more exotic features of lida should be on the analysis side. The code can be scanned for custom sequences, known antidebugging techniques, known encryption algorithms, ... also you will be able to directly work with the programs data and for example pass it to several customizable en-/decryption routines.
This of course only makes limited sense as it is not a debugger. Tough often I really missed this functionality.
3.1 Limitations of objdump based disassemblers
As I have often been asked - so what are the limitations of objdump? First to say, objdump expects to get a nicely compiled executable by gcc. Usual programs one would like to disassemble are either coded directly in assembly, or use some tricks to avoid beeing disassembled. I will here give a short overview of the most stupid objdump features
- objdump relies on section headers
an ELF executable "usually" contains correct section headers. Tough for the OS-loader to run an ELF binary, section headers are not necessary at all. The important thing to get a process loaded into memory are the program headers .
So the first common "anti disassembling trick" is to either drop or manipulate the ELF section headers (I have seen to even duplicate them a few hundred times :) , or overlap them, bogus size, ...).
By doing so, objdump refuses to perform the disassembly:
mario@localhost> file tiny-crackme
tiny-crackme: ELF 32-bit LSB executable, Intel 80386, version 1, statically linked, corrupted section header size
mario@localhost> objdump -D tiny-crackme
objdump: tiny-crackme: File format not recognized
The binary I took as example to verify is yanisto's tiny-crackme
- objdump does not trace the execution flow I
By not tracing the execution flow objdump can easily be fooled to just disassemble a few lines and stop there.
This means it does not recognize any functions, does not "see" the code which is stored in data sections.
- objdump does not trace the execution flow II
Additionally another common trick is to insert garbage opcodes and "overjump" them to disalign the disassembly from the execution flow.
Example: When an instruction jumps into the middle of the next instruction, objdump does not disassemble from this exact location. It will
continue with the next instruction and consequently dissasemble garbage from here on.
As a result you will mainly see totally usesless instructions in the whole disassembly.
As a verbal description is maybe hard to understand I do give an example here as well:
mario@localhost:> objdump -d x.o

x.o:     file format elf32-i386

Disassembly of section .text:

00000000 <label1>:
   0:   e9 0e 00 00 00          jmp    13 <label3+0x1>	;disassembly does not follow this jump!
   5:   05 14 00 00 00          add    $0x14,%eax

0000000a <label2>:
   a:   e9 03 00 00 00          jmp    12 <label3> ; this just to show you the opcodes of a
                                                   ; jmp +3 instruction which I hide at address label3+1
   f:   90                      nop
  10:   90                      nop
  11:   90                      nop

00000012 <label3>:
  12:   eb e9                   jmp    fffffffd <label3+0xffffffeb> ; here the jmp +3 instruction is "hidden"
  14:   03 00                   add    (%eax),%eax
  16:   00 00                   add    %al,(%eax)
        ...
As you can see, objdump does not recognize that the jump label2+1 goes to address 13. It just disassembles linear from top to bottom.
So objdump shows us at address 12 a totally useless "jmp" instruction followed by 2 add instructions.
In reality the program would execute the instruction at address 13, which is a jmp to 1b (jmp +3).
- I do not plan to write an objdump analysis here and do not claim for completeness, so I will leave it with those examples. I guess you get the picture :) And hope you see why objdump is too limited for disassembly usage on the most basic tricks.
4. Implementation Details
lida uses libdasm of the bastard for single opcode decoding. It does not use the whole environment including the typhoon database.
The main program is coded in perl/TK - which uses a C backend for the most timeconsuming parts (disassembly, analysis, scanning for strings).
Generally lida is designed to be as fast as possible (the disassembly) - by trying not to waste all your RAM :)
lida is designed to be also efficient in usability. Therefore all important functions are accessible via single keystrokes, or short commands. This means no clicking around is necessary, you can enter your tasks directly into the "commandline".
4.1 Some words about the disassembling engine
The disassembling engine
The disassembling is done in currently 4 (or 6) passes, default is all 6:
- 1st pass - is the main control flow disassembly
Here the disassembly is started from the executables entrypoint, and recursively
disassembles the binary by following each branch, and stepping into each sub-
routine.
This leads in also disassembling code blocks in data sections, if existent :),
so the disassembly is not limited to a .text section.
Also, if indirect jumps/calls are used, the final destination is looked up
in the binaries data of course
- 2nd pass - for glibc binaries:
A heuristic scan scans for the main() function and starts pass1 there (so also re-
cursive disassembling)
- 3rd pass - all other code sections
This pass repeats pass1 for all found executable sections, and starts at section
start. If the binary does not contain section headers, the disassembly starts
at the first loaded executable address.
- 4th pass - functions
This pass scans for typical function prologues and starts pass1 at each found
address. This is for discovering code regions which are not explicitly called,
and where their entrypoints are evaluated at runtime.
- 5th pass - disassembling caves
All passes build up a map of the binary. If until now there are code regions
which were not yet disassembled, they can be now.
- 6th pass - remainders
If pass 5 was executed, and there are still caves, they are displayed as DB xx, ...
Definitely for pass 4 and 5 there are enhancements to come, as well as for the recursive
disassembly function itself.
Also to mention whenever a jump into the middle of a previous instruction is beeing found,
currently those addresses are beeing marked. To follow is a representation of "instructions
within instructions" (compare 3.1), as of course by intelligent placing of opcodes both
instructions can be valid and used during the execution flow.
4.2 Some words about the crypto analyzer
The crypto analyzer is used to find code which is a potential en-/decryption
routine.
The focus is to find code blocks where an encryption or decryption is beeing done,
not to analyze the data blocks for potentially beeing encrypted. So lida tries to find
for you the ALGORYTHM itself.
This is a major difference!
While lida's goal is to analyze the code (mainly), of course another approach can be token to
do frequency analysis, entropy measurement, ... to analyze characteristics of the data
blocks to find parts of encrypted data.
Then by looking for references to those datablocks one would find the locations where the
en-/de cryption is beeing done. now for 2 reasons I chose another approach:
- often those datablocks are not directly referenced to.
the addresses are calculated
during runtime, so your disassembler can not help you finding those. you would need
to debug and use probably a breakpoint on memory range acces to find the algorythm.
- usually why we analyze encrypted data is because we want to decrypt it, or see how
the encryption algorythm works.
So the main goal is to find the code location where
the algorithm is beeing done. lida just helps you to find those locations, so you need
not to debug before you find the code-location similar as described above.
now you can analyze the code and eg place your breakpoint after that algorythm and
verify the memory locations to see your decrypted data block
Actually to be accurate lida does both: it scans data and code. So how does this work?
4.2.1 "Signature Scanning"
Basically it is done by a "signature scanning". I quote it because it is not a simple pattern matching.
For understanding that, one needs a little understanding of typical hash-(md5, sha, ...)/encryption (blowfish, ...) algorythms.
Let's take for example a MD5 hash. How can we find the code that does an MD5 hash?
On a very high level generating a hash is usually done in 3 steps: the init function, the update function
and the finalize function.
The init function usually sets up an array of some numeric values, which are then modified
in a loop using the input data (plain data) during the algorythm, until the hash is
calculated.
The finalize function creates the representation in a common format (easily
spoken; it pads the digest and is appending the size).
Hoewever, it does not matter to know actually how the algorythm works to find it :)
Due to the common fact, that the initialization functions use fixed numeric initialization values, which are the same in every implementation, as they are part of
the algorythm - these are the values we are searching for.
For MD5 those are:
0x67452301
0xefcdab89
0x98badcfe
0x10325476
Now as those values perfectly fit into 32 bit registers, the implementation is nearly always
done by loading those numbers into several registers sequentially, or by directly feeding those values
into a memory location.
An example implementation of
the MD5_Init function in assemlber looks like this:
                        push    edi
                        lea     edi, Init_Vector
                        mov     [edi+0], 67452301h
                        mov     [edi+4], efcdab89h
                        mov     [edi+8], 98badcfeh
                        mov     [edi+c], 10325476h
                        pop     edi
                        ret
So to find an MD5 implementation, it is necessary to scan for those dword values, of course they can appear in any order
(strange enough nearly always they are used in the listed order above). Now as those dwords can exist also in just any binary
by accident (oltough seldom) some smarter scanning is done: the values need to appear in a limited size of a code block.
The values can be in any order, and also some fuzzyness has been added to scan for "a little bit altered" init values.
Another check is searching for the so called "pre computed S-Box values", this will be described later....
4.2.2 "Heuristic Scanning"
Heuristic scanning is not yet implemented. It is intended to find custom crypto code.
Basically it is beeing looked for a sequence of suspicious opcode sequences, which "look like" an encryption routine.
This is just for fun and more an experiment how accurate search results can be made :)
To be continued ...
5. What is the current status?
Currently the following items work:
- work with sstripped ELF files (no section headers), and corrupted section headers
- analyze execution flow for disassembling
- scanning for functions by typical prologue codesequences
- basic cryptoanalization (ripemd160, md2, md4, md5, blowfish, cast, des, rc2, sha)
- disassemble in code and data sections (all loaded blocks)
- let you disassemble custom address ranges (code + data)
- display execution cross references
- display string data references
- display symbols
- display destinations of pointers (values for indirect addressing)
- let you add/rename labels/symbols
- let you add/rename comments
- representation of data blocks between code areas
- provide case in-/sensitive text search (find, find next)
- provide binary search (range delimited, or over whole address range)
- syntax highlighting
- bookmarks can be set (new in v00.03.00)
- let you browse the code very efficiently (keyboard shortcuts, "jump stack")
- let you load a deadlisting of previous session
- dump of disassembly to textfile (new in v00.03.00)
- disassembly is DAMN fast :)
6. Screenshots
This is how lida currently looks like:

The disassembler,
cryptoanalyzer,
bookmarks
|
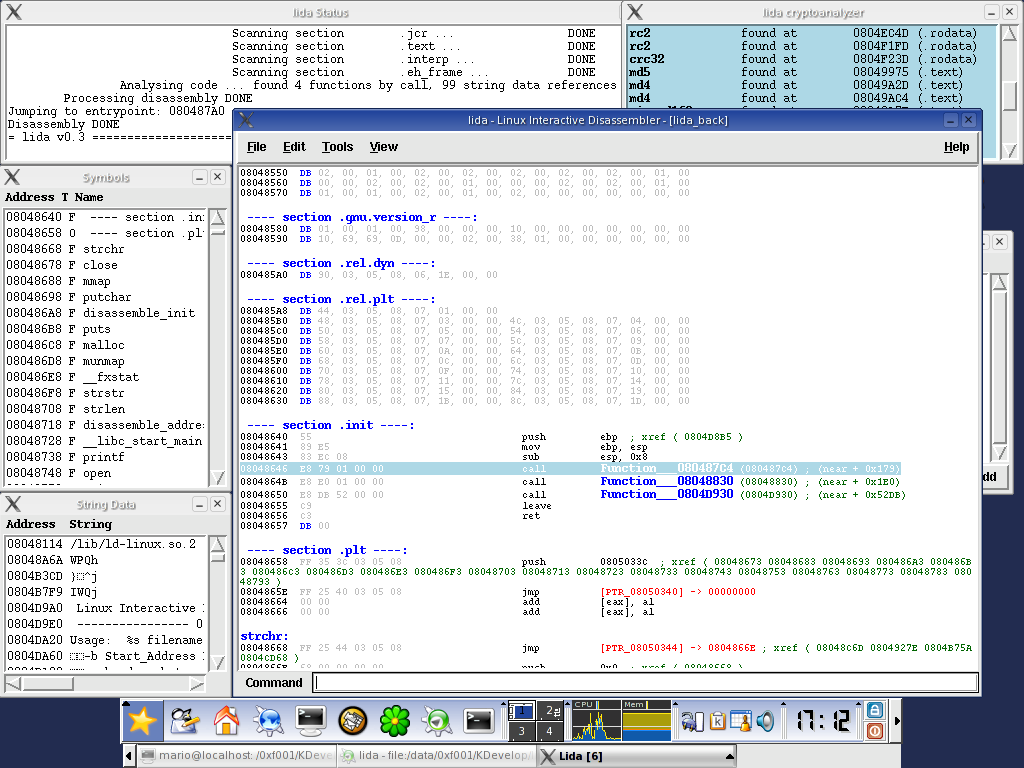
Data blocks
|
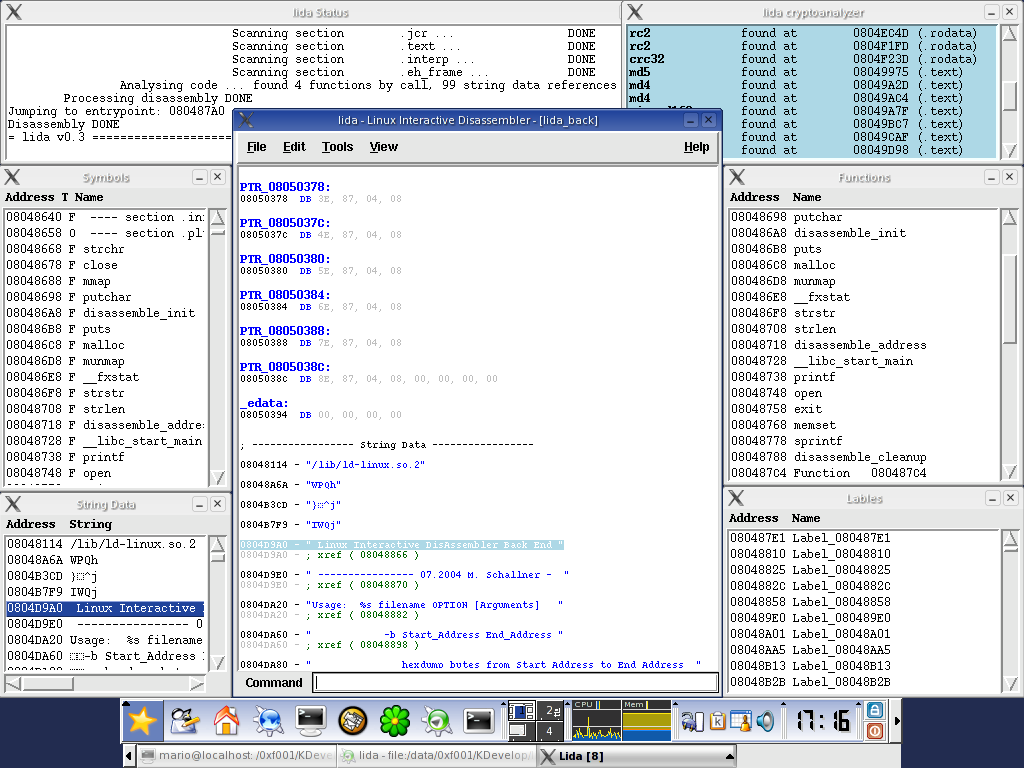
String data references
|
7. Where can I download?
lida is currently in pre alpha status and under heavy development. Yet it can already be tried out, the package is available at http://sourceforge.net/projects/lida.
Interested people feel free to contact the author.
8. Credits
... go to HCUNIX, esp mammon_ :)
|